Safety stock and reorder points for DTC brands, with a worked example
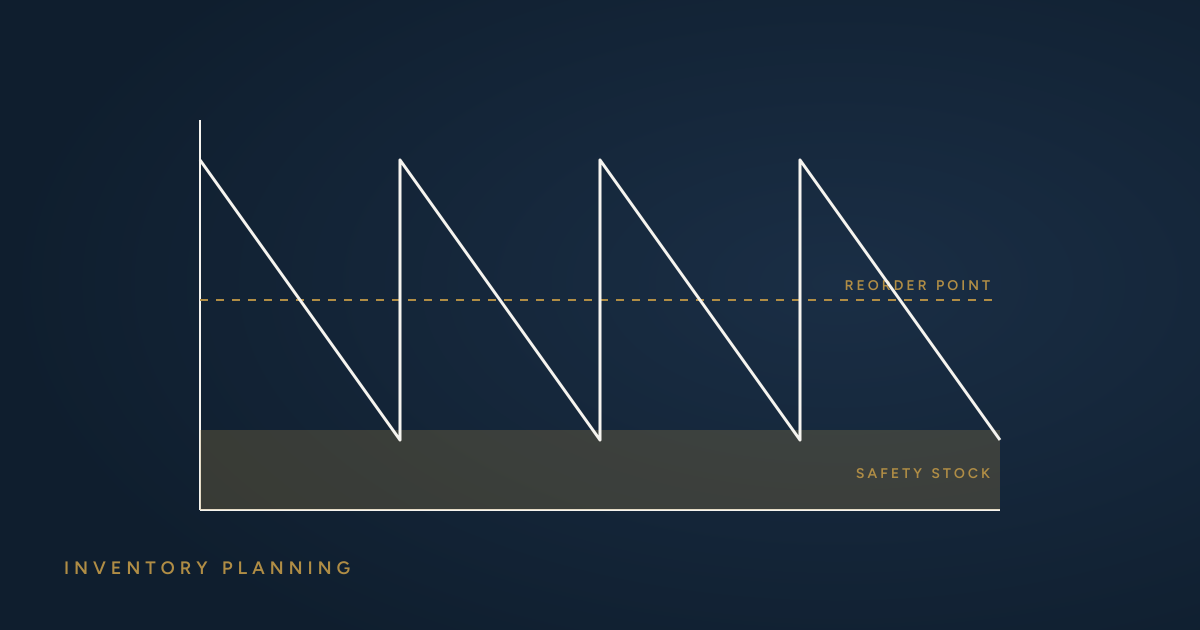
Stockouts kill growth: lost sales, paused ads, and lost ranking on marketplaces. Overstock kills cash. Most DTC brands swing between the two because they reorder on gut feel. Safety stock and reorder points replace the guessing with a rule, and the maths is simpler than it looks.
The two numbers
Reorder point: the stock level at which you place the next order. When inventory on hand plus on order falls to this number, you reorder.
Safety stock: the buffer inside the reorder point that covers you when demand runs higher than expected or a shipment runs late.
Reorder point = average daily demand × lead time + safety stock
Calculating safety stock
A common formula, when demand varies but lead time is fairly stable:
Safety stock = Z × σd × √lead time
- Z is the service level factor. It sets how often you're willing to run out during a replenishment cycle. Z of 1.65 covers about 95% of cycles; 1.28 covers about 90%; 2.05 about 98%.
- σd is the standard deviation of daily demand, which you can calculate from the last 60 to 90 days of sales.
- Lead time is in days, from placing the order to stock being available to sell.
If your lead times also vary a lot, which is common with ocean freight, use a fuller formula that includes lead-time variability, or add a fixed buffer of extra days to cover typical delays.
A worked example
The figures below are illustrative. A SKU sells an average of 40 units a day, with a standard deviation of 12 units a day. Lead time from order to sellable stock is 75 days. The brand wants a 95% service level, so Z = 1.65.
Safety stock = 1.65 × 12 × √75 = 1.65 × 12 × 8.66 ≈ 171 units.
Reorder point = 40 × 75 + 171 = 3,171 units.
When inventory on hand plus inventory already on order drops to around 3,170 units, it's time to place the next order.
Notice that safety stock is small compared with the stock needed to cover the lead time itself. For brands importing from Asia, long lead times, not demand swings, are what drive inventory levels. Cutting lead time by two weeks would lower the reorder point by more than 550 units.
Choosing a service level
A higher service level means fewer stockouts and more cash in stock, and the cost rises steeply near 100%. A practical approach:
- Hero SKUs that drive revenue and ad performance: 95 to 98%.
- Steady core SKUs: 90 to 95%.
- Long-tail or seasonal SKUs: 80 to 90%, or order to demand rather than holding a buffer.
Common mistakes
- Using one rule for every SKU. Different SKUs need different service levels and buffers.
- Forgetting stock on order. The reorder trigger should count inventory on the water and in production, not just what's on the shelf.
- Counting stockout days as zero demand. Days you were out of stock understate true demand. Exclude them or adjust for them.
- Ignoring seasonality and promotions. Plan peak periods and launches separately, on top of the baseline.
- Setting it once. Recalculate monthly as demand and lead times change.
Start simple
A spreadsheet with one row per SKU, its average demand, demand variability, lead time and chosen service level is enough to begin. Review the reorder list every week. That alone puts most brands ahead of where they were.
Frequently asked questions
What service level should a DTC brand use?
95 percent is a sensible default. Use 97.5 to 99 percent for hero SKUs where a stockout costs you ad momentum, and 85 to 90 percent for slow movers where holding stock is expensive.
Does the safety stock formula account for late suppliers?
Only if you include lead time variability. The full formula is z × √(lead time × σdemand² + demand² × σlead time²). Leaving the second term out is why so many stockouts follow a delayed shipment.
How do I calculate the reorder point?
Average daily demand × lead time in days, plus safety stock. Compare it with stock on hand plus stock already on order. Our safety stock calculator does the arithmetic.
Want this checked on your own numbers?
Start with a fixed-scope audit of your invoices, contracts and inventory data, or bring us in to fix a specific problem. Either way, the first call is free.
Book a call