Unit economics and contribution margin for DTC brands
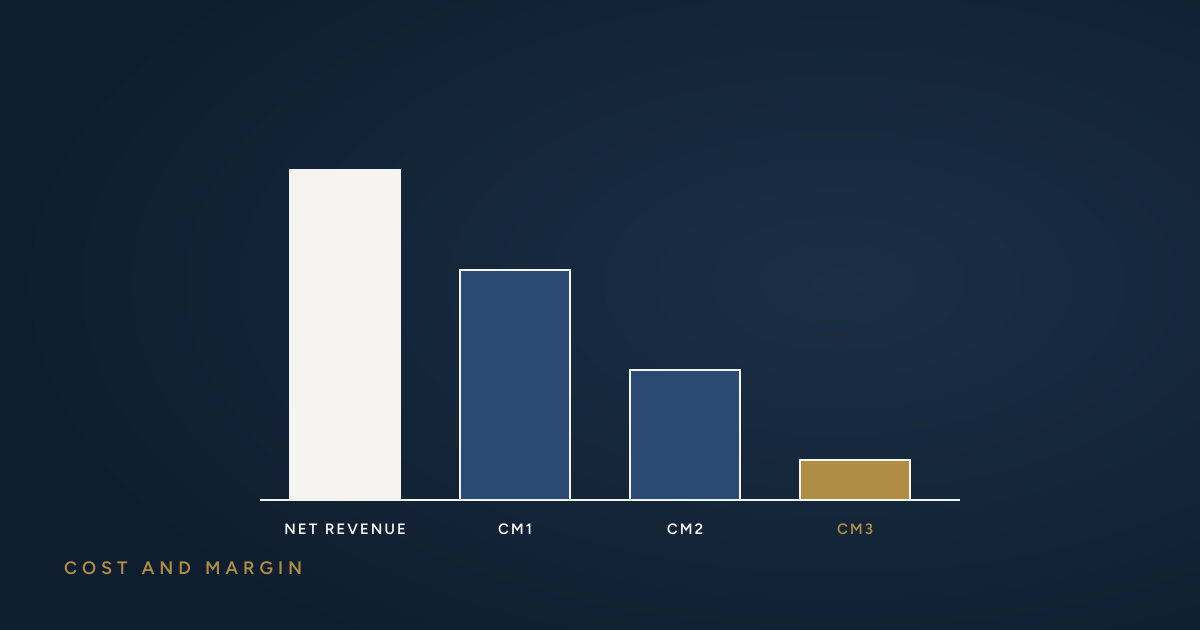
Gross margin tells you whether a product is worth making. Contribution margin tells you whether each order is worth taking. Most DTC brands track the first carefully and guess at the second.
The three layers
A clean way to see DTC unit economics is in three layers of contribution margin, each subtracting the next set of variable costs.
CM1: product margin. Net revenue minus landed cost of goods. Net revenue is the price the customer actually paid after discounts, excluding sales tax or VAT.
CM2: margin after fulfilment. CM1 minus the costs of getting the order to the customer and handling it: pick and pack, packaging, outbound shipping, payment processing fees, and the expected cost of returns.
CM3: margin after marketing. CM2 minus the variable marketing cost to win the order, usually paid acquisition cost for new customers.
CM3 is what's left to pay for fixed costs like salaries, software and rent, and for profit.
A worked example
The figures below are illustrative, for a single order of a $60 product.
| Line | Per order | % of net revenue |
|---|---|---|
| Price | $60.00 | |
| Average discount | −$6.00 | |
| Net revenue | $54.00 | 100% |
| Landed cost of goods | −$16.00 | |
| CM1 | $38.00 | 70% |
| Pick, pack and packaging | −$4.50 | |
| Outbound shipping | −$8.50 | |
| Payment processing | −$1.80 | |
| Returns (8% rate × cost per return) | −$2.20 | |
| CM2 | $21.00 | 39% |
| Blended acquisition cost per order | −$15.00 | |
| CM3 | $6.00 | 11% |
A 70% product margin turns into an 11% margin per order once operations and marketing are paid for. That's normal, and it's why the operational lines matter so much. Cutting fulfilment and shipping costs by $2 an order lifts CM3 by a third.
Common mistakes
- Using FOB instead of landed cost. It overstates CM1, sometimes by 20 points or more.
- Using list price instead of net revenue. Discounts and promotions are real reductions in revenue.
- Ignoring returns. Return shipping, processing and unsellable stock are part of the cost of every order, spread across all orders.
- Averaging across everything. Blended margins hide SKUs and channels that lose money on every order. Calculate per SKU, per channel and per order size.
- Treating free shipping as free. It's a cost, and it often sits in the wrong line.
The operational levers
CM1: freight, duty and supplier negotiations; landed cost allocation; discount discipline.
CM2: 3PL rates, packaging and dimensional weight, carrier contracts, warehouse location, returns policy.
CM3: average order value and units per order, repeat purchase rate, and channel mix.
Increasing units per order is one of the strongest levers, because pick fees, shipping and acquisition costs are mostly paid per order, not per unit.
Make it routine
Build a simple monthly contribution margin report, by SKU and by channel. When CM2 slides, look at operations. When CM3 slides, look at marketing. Either way you'll know where to look.
Frequently asked questions
What is a good contribution margin for a DTC brand?
Many DTC brands aim for a CM2 (after product, fulfilment, shipping, returns and payment fees) of 40 to 50 percent of net revenue, and a positive CM3 after acquisition cost on the first order or within a few repeat orders.
Should returns be included in contribution margin?
Yes. Refunded units come off revenue, unsellable returns are a product cost, and the return label and processing are a variable cost. A 10 percent return rate can take 5 to 8 points off margin.
What is break-even CAC?
The most you can spend to acquire a new customer before the first order stops paying for it: CM2 divided by the share of orders that come from new customers. Our contribution margin calculator shows it.
Want this checked on your own numbers?
Start with a fixed-scope audit of your invoices, contracts and inventory data, or bring us in to fix a specific problem. Either way, the first call is free.
Book a call